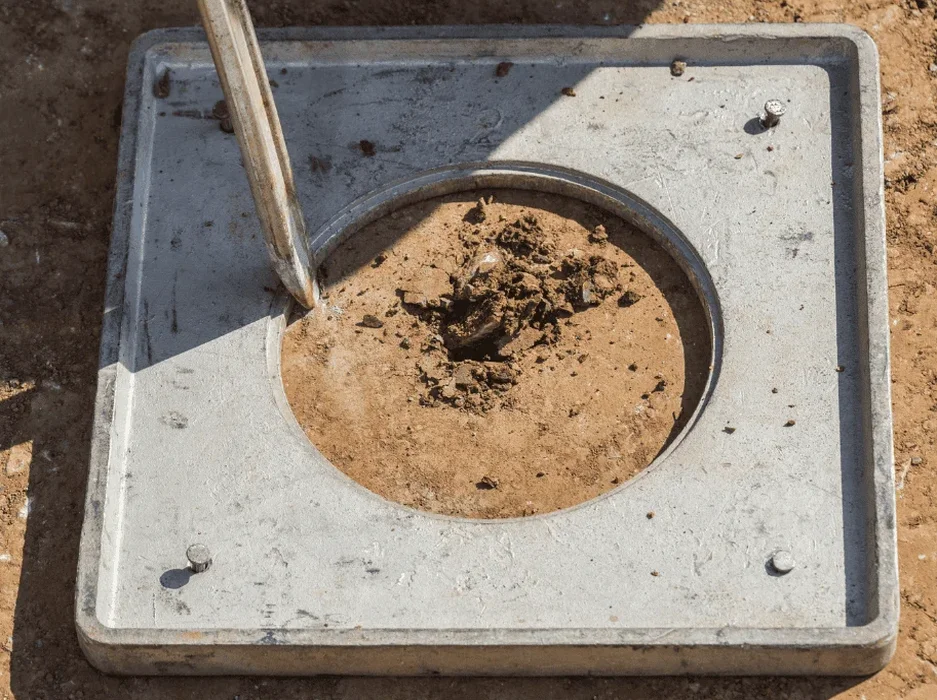
A split-spoon sampler driven by a 140-pound hammer falling 30 inches. That is the starting point for every liquefaction assessment we run in the Atlanta metro. The Piedmont residuum beneath this city is old, stiff, and partially cemented; most engineers assume it will not liquefy. But assumptions are not analysis. When a project triggers a site-specific peak ground acceleration check under ASCE 7-22 Section 21.3, we pull SPT blow counts, measure fines content on split samples, and compute the cyclic stress ratio that the design earthquake demands. The sampler tells us more than N-values. It reveals seams of micaceous silt within the weathered gneiss that control pore pressure response during shaking. In our experience, the critical layer in Atlanta is never the hard saprolite at 50 feet. It is the 8-to-15-foot band of alluvial terrace deposit along creeks like Peachtree Creek or Proctor Creek. That layer demands a detailed SPT drilling campaign with hammer energy calibration, because uncorrected N-values will overestimate resistance and mask a real liquefaction hazard.
Liquefaction in residual soils is rare but not impossible—it is the alluvial pockets within the Piedmont that demand a site-specific CSR calculation.
Technical details of the service in Atlanta
Typical technical challenges in Atlanta
Two sites 600 feet apart in the same watershed can produce completely different liquefaction outcomes. In the low-lying ground near the Chattahoochee River at the Fulton-Cobb line, we typically encounter 12 to 18 feet of loose sandy silt over weathered gneiss—water table at 6 feet, N60 values below 12, and fines content between 15 and 35 percent. That combination triggers a factor of safety below 1.2 for a PGA of 0.15g. But move upslope into the Morningside-Lenox Park area, where the residuum is stiff silty sand derived from in-place weathering of biotite gneiss, and the same seismic demand yields factors of safety above 2.5. The difference is overconsolidation and cementation. The risk is not uniform across the metro, and blanket statements about “non-liquefiable Piedmont soils” are dangerous. We have measured post-liquefaction settlement estimates exceeding 1.5 inches in the Peachtree Creek floodplain—enough to cause differential movement in shallow footings. For critical structures, that number drives the decision between ground improvement and deep foundations. The cost of ignoring a thin alluvial lens can exceed the cost of a six-borehole investigation by a factor of fifty.
Our services
A liquefaction trigger analysis is only as good as the subsurface data it relies on. Our work in Atlanta combines two investigative phases that feed directly into the CSR calculation.
SPT-based liquefaction screening with energy calibration
We measure hammer energy ratio on every Atlanta rig using PDM rod instrumentation. The corrected N60 profile feeds the cyclic resistance ratio calculation per NCEER methodology, and we report factor of safety against liquefaction for each potentially liquefiable layer.
LPI mapping and post-liquefaction settlement analysis
Using the Liquefaction Potential Index integrated over the upper 20 meters, we produce contour plans that identify zones requiring ground improvement. Settlement estimates follow Ishihara & Yoshimine, keyed to the computed factor of safety and SPT blow count.
Common questions
Does Atlanta have a real liquefaction risk given its distance from major faults?
Yes, under certain site conditions. The USGS National Seismic Hazard Model assigns a 2475-year PGA of 0.12g to 0.18g for the Atlanta metro on Site Class D. While the residual Piedmont soils are generally dense and overconsolidated, pockets of Holocene alluvium along the Chattahoochee River and its tributaries can exhibit low SPT N-values and high water tables. When the cyclic stress ratio from a design earthquake exceeds the cyclic resistance ratio of those layers, liquefaction triggering is possible. We have calculated factors of safety below 1.1 in alluvial deposits less than 20 feet deep, which requires either ground improvement or a deep foundation solution.
What is the cost range for a site-specific liquefaction analysis in Atlanta?
A full liquefaction screening study including SPT drilling with energy calibration, laboratory fines content testing, CSR/CRR computation, LPI mapping, and a signed engineering report typically falls between US$2,590 and US$4,080, depending on the number of boreholes and the depth of the alluvial sequence. Projects requiring downhole seismic for Vs profiling or additional CPT soundings will be at the upper end of the range.
Which correction factors matter most for Atlanta residual soils?
In our Piedmont profiles, three corrections dominate the outcome. First, hammer energy ratio correction to N60—we measure this on every rig because safety hammers with rope-and-cathead systems can deliver as little as 45% of theoretical energy. Second, fines content correction using the Boulanger & Idriss (2014) relationship, because the micaceous silt fraction in weathered gneiss significantly shifts the CRR curve. Third, overburden correction Kσ, which becomes critical below 30 feet where vertical effective stress suppresses the apparent liquefaction susceptibility. Without these three corrections, the analysis will either miss a real hazard or flag false positives.